Information about the methods used in this report is available here and appendix with detailed tables and data sources.
Among the U.S. population overall, crude estimates for 2021 were:
Table 1a. Estimated crude prevalence of diagnosed diabetes, undiagnosed diabetes, and total diabetes among adults aged 18 years or older, United States, 2017–2020
| Characteristic | Diagnosed diabetes Percentage (95% CI) | Undiagnosed diabetes Percentage (95% CI) | Total diabetes Percentage (95% CI) |
|---|---|---|---|
| Total | 11.3 (10.3–12.5) | 3.4 (2.7–4.2) | 14.7 (13.2–16.4) |
| Age in years | |||
| 18–44 | 3.0 (2.4–3.7) | 1.9 (1.3–2.7) | 4.8 (4.0–5.9) |
| 45–64 | 14.5 (12.2–17.0) | 4.5 (3.3–6.0) | 18.9 (16.1–22.1) |
| ≥65 | 24.4 (22.1–27.0) | 4.7 (3.0–7.4) | 29.2 (26.4–32.1) |
| Sex | |||
| Men | 12.6 (11.1–14.3) | 2.8 (2.0–3.9) | 15.4 (13.5–17.5) |
| Women | 10.2 (8.8–11.7) | 3.9 (2.7–5.5) | 14.1 (11.8–16.7) |
| Race-Ethnicity | |||
| White, non-Hispanic | 11.0 (9.4–12.8) | 2.7 (1.7–4.2) | 13.6 (11.4–16.2) |
| Black, non-Hispanic | 12.7 (10.7–15.0) | 4.7 (3.3–6.5) | 17.4 (15.2–19.8) |
| Asian, non-Hispanic | 11.3 (9.7–13.1) | 5.4 (3.5–8.3) | 16.7 (14.0–19.8) |
| Hispanic | 11.1 (9.5–13.0) | 4.4 (3.3–5.8) | 15.5 (13.8–17.3) |
Notes: CI = confidence interval. Time period 2017–2020 covers January 2017 through March 2020 only. Diagnosed diabetes was based on self-report. Undiagnosed diabetes was based on fasting plasma glucose and A1C levels among people self-reporting no diabetes. Numbers for subgroups may not add up to the total because of rounding. Age-adjusted estimates are presented in Appendix Table 1. Data source: 2017–March 2020 National Health and Nutrition Examination Survey.
Table 1b. Estimated number of adults aged 18 years or older with diagnosed diabetes, undiagnosed diabetes, and total diabetes, United States, 2021
| Characteristic | Diagnosed diabetes Number in Millions (95% CI) | Undiagnosed diabetes Number in Millions (95% CI) | Total diabetes Number in Millions (95% CI) |
|---|---|---|---|
| Total | 29.4 (26.7–32.0) | 8.7 (7.0–10.5) | 38.1 (34.2–42.0) |
| Age in years | |||
| 18–44 | 3.5 (2.8–4.2) | 2.2 (1.5–3.0) | 5.8 (4.7–6.8) |
| 45–64 | 12.0 (10.1–13.9) | 3.8 (2.7–4.8) | 15.8 (13.4–18.2) |
| ≥65 | 13.8 (12.5–15.1) | 2.7 (1.6–3.8) | 16.5 (15.0–18.1) |
| Sex | |||
| Men | 16.1 (14.1–18.0) | 3.7 (2.6–4.8) | 19.8 (17.4–22.1) |
| Women | 13.3 (11.5–15.1) | 5.0 (3.3–6.7) | 18.3 (15.3–21.3) |
| Race-Ethnicity | |||
| White, non-Hispanic | 17.8 (15.2–20.4) | 4.3 (2.4–6.1) | 22.1 (18.5–25.7) |
| Black, non-Hispanic | 4.0 (3.3–4.6) | 1.4 (1.0–1.9) | 5.4 (4.7–6.1) |
| Asian, non-Hispanic | 1.8 (1.5–2.1) | 0.9 (0.5–1.2) | 2.7 (2.2–3.1) |
| Hispanic | 5.0 (4.3–5.7) | 1.9 (1.4–2.4) | 6.9 (6.2–7.6) |
Notes: CI = confidence interval. Estimated numbers for 2021 were derived from percentages for 2017–March 2020 applied to July 1, 2021, U.S. resident population estimates from the U.S. Census Bureau (See detailed methods and data sources). Diagnosed diabetes was based on self-report. Undiagnosed diabetes was based on fasting plasma glucose and A1C levels among people self-reporting no diabetes. Numbers for subgroups may not add up to the total because of rounding.
Data sources: 2017–March 2020 National Health and Nutrition Examination Survey; 2021 U.S. Census Bureau data.
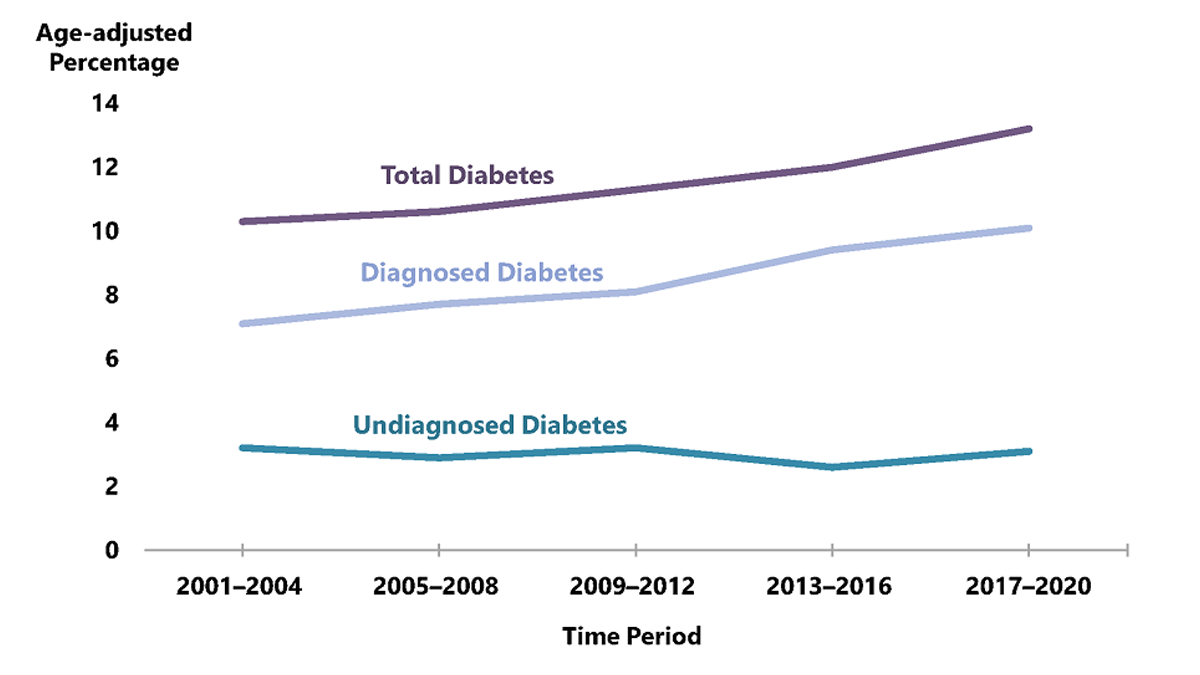
Figure 1. Trends in age-adjusted prevalence of diagnosed diabetes, undiagnosed diabetes, and total diabetes among adults aged 18 years or older, United States, 2001–2020

Notes: Diagnosed diabetes was based on self-report. Undiagnosed diabetes was based on fasting plasma glucose and A1C levels among people self-reporting no diabetes. Time period 2017–2020 covers January 2017 through March 2020 only.
Among the U.S. population overall, crude estimates for 2021 were:
Among U.S. adults aged 18 years or older, age-adjusted data for 2019–2021 indicated the following:
Figure 2. Age-adjusted estimated prevalence of diagnosed diabetes by metropolitan residence and sex for adults aged 18 years or older, United States, 2019–2021
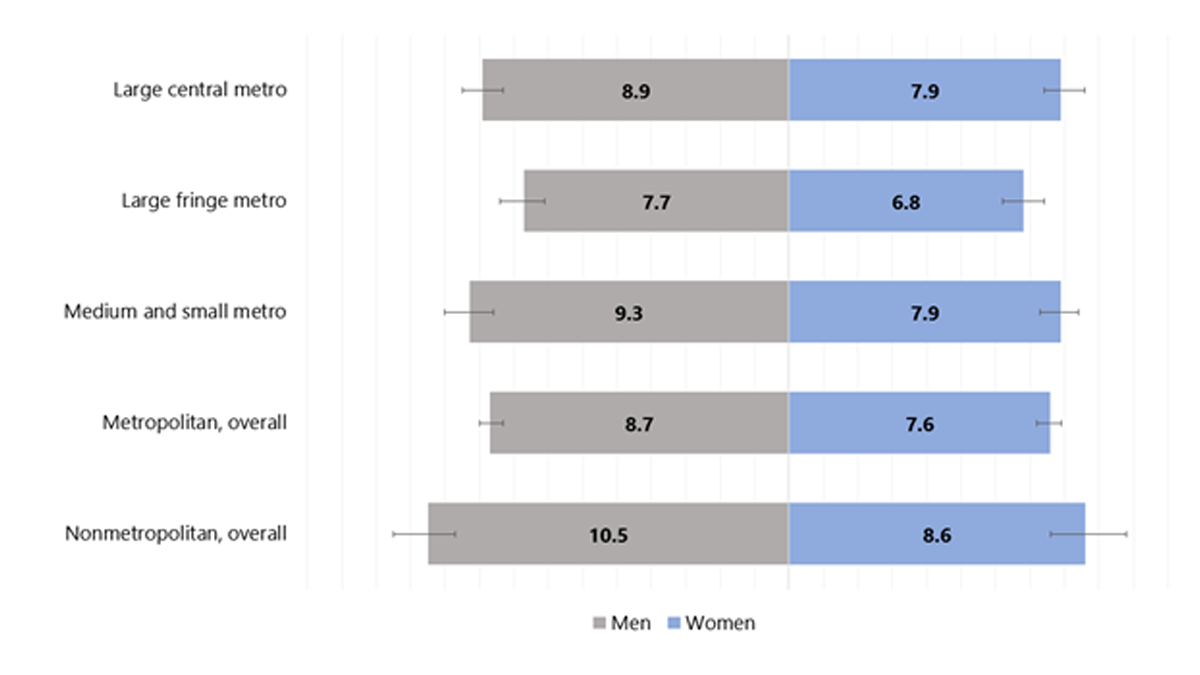
Note: Error bars represent upper and lower bounds of the 95% confidence interval.
Table 2. Crude prevalence of diagnosed diabetes by detailed race and ethnicity among adults aged 18 years or older, United States, 2019–2021
| Race and Ethnicity Subgroup | Total Percentage (95% CI) |
|---|---|
| American Indian or Alaska Native, non-Hispanic | 16.0 (12.1–20.6) |
| Black, non-Hispanic | 12.5 (11.6–13.4) |
| Native Hawaiian or Other Pacific Islander, non-Hispanic | 11.7 (7.4–17.2) |
| Asian, non-Hispanic | 9.2 (8.2–10.4) |
| Asian Indian, non-Hispanic | 10.8 (8.3–13.7) |
| Chinese, non-Hispanic | 7.1 (5.2–9.3) |
| Filipino, non-Hispanic | 12.2 (9.4–15.6) |
| Japanese, non-Hispanic | 6.8 (4.1–10.5) |
| Korean, non-Hispanic | 6.1 (3.8–9.1) |
| Vietnamese, non-Hispanic | 6.4 (3.7–10.0) |
| Other Asian, non-Hispanic | 8.9 (5.9–12.8) |
| Hispanic | 10.3 (9.4–11.1) |
| Mexican or Mexican American | 11.1 (9.9–12.3) |
| Central American | 7.3 (5.6–9.4) |
| South American | 5.0 (3.3–7.1) |
| Puerto Rican | 13.3 (11.0–15.9) |
| Cuban | 9.0 (6.5–12.1) |
| Dominican | 9.4 (5.9–14.2) |
| Other Hispanic, Latino, or Spanish | 7.2 (5.5–9.2) |
| White, non-Hispanic | 8.5 (8.2–8.8) |
Note: CI = confidence interval. Data sources: National Center for Health Statistics; 2019–2021 National Health Interview Survey.
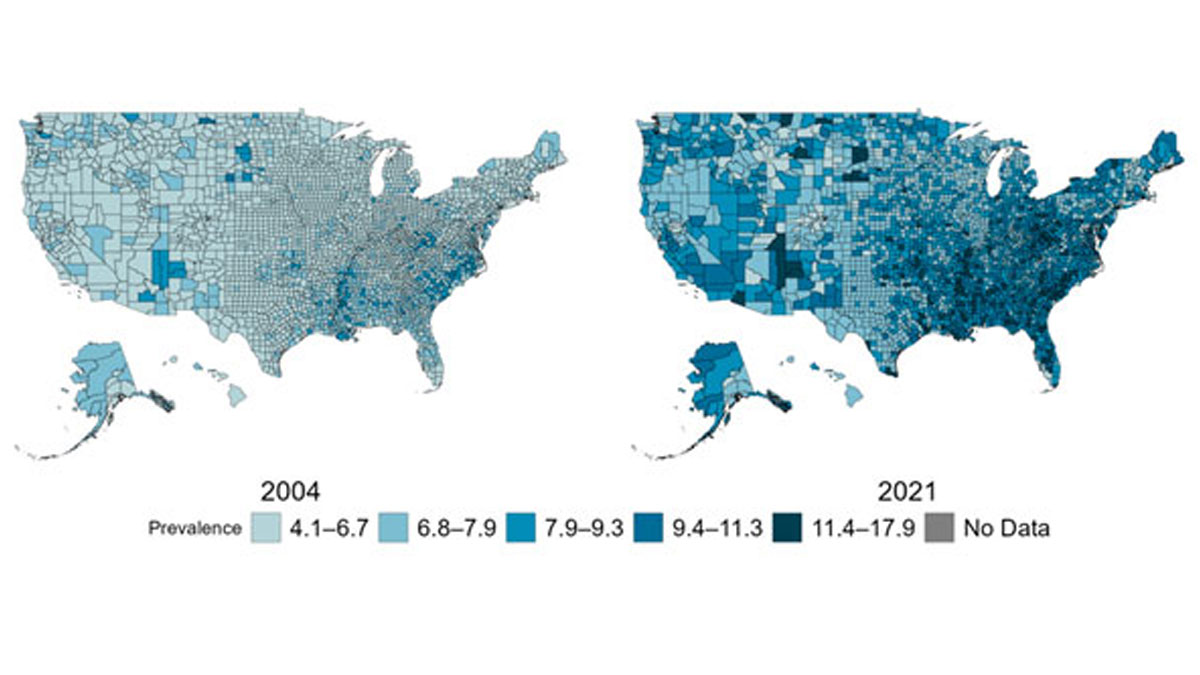
Among U.S. adults aged 20 years or older, age-adjusted, county-level data indicated:
Figure 3. Age-adjusted, county-level prevalence of diagnosed diabetes among adults aged 20 years or older, United States, 2004 and 2021
Among U.S. adults aged 18 years or older, crude estimates for 2021 were:
Among U.S. adults aged 18 years or older, age-adjusted data for 2019–2021 indicated:
Table 3. Estimated crude incidence of diagnosed diabetes among adults aged 18 years or older, United States, 2019–2021
| Characteristic | Population Estimates, 2021 a Number in Thousands (95% CI) | Incidence Estimates, 2019–2021 Rate per 1,000 (95% CI) | |
|---|---|---|---|
| Total | 1,211 (1,094–1,328) | 5.9 (5.1–6.9) b | |
| Age in years | |||
| 18–44 | 305 (241–369) | 3.0 (2.1–4.2) b | |
| 45–64 | 633 (550–716) | 10.1 (8.2–12.4) b | |
| ≥65 | 273 (222–325) | 6.8 (5.1–8.9) b | |
| Sex | |||
| Men | 620 (536–704) | 6.4 (5.2–7.9) b | |
| Women | 591 (510–672) | 5.5 (4.4–6.9) b | |
| Race/ethnicity | |||
| White, non-Hispanic | 721 (633–809) | 5.1 (4.5–5.8) | |
| Black, non-Hispanic | 185 (139–232) | 6.8 (5.3–8.7) | |
| Asian, non-Hispanic | 52 (29–76) | 3.8 (2.4–5.9) | |
| Hispanic | 233 (178–289) | 6.1 (4.8–7.7) | |
CI = confidence interval.
a Population estimates for 2021 were derived from rates for 2019–2021 applied to July 1, 2021 U.S. resident population estimates from the U.S. Census Bureau (See Appendix B: Detailed Methods).
b Rates were calculated using 2021 data only.
Data sources: 2019–2021 National Health Interview Survey and 2021 U.S. Census Bureau data.
Figure 4. Trends in age-adjusted incidence of diagnosed diabetes among adults aged 18 years or older, United States, 2000–2021
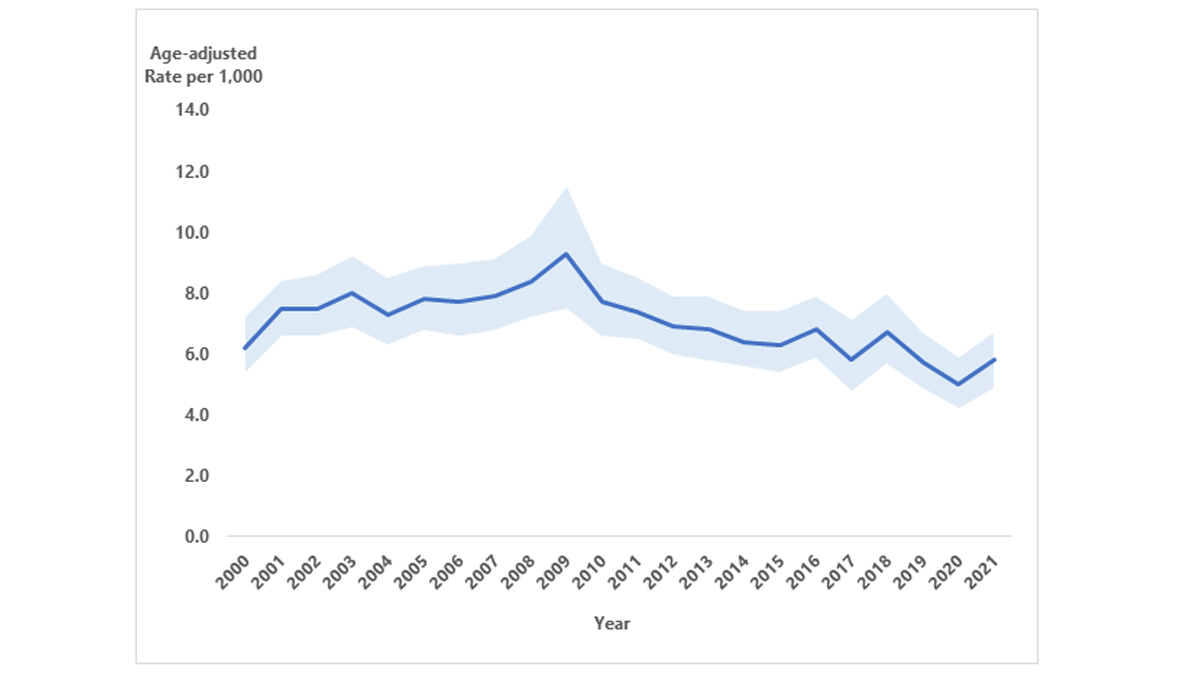
Notes: Data shown are estimated incidence rates (solid blue line) and 95% confidence intervals (shaded). Joinpoint identified in 2008 (see Appendix B: Detailed Methods and Data Sources). Because of changes to the survey design and survey instruments after 2018, comparisons of the 2000–2018 and 2019–2021 data should be examined with caution.
Among US adults aged 20 years or older, age-adjusted, county-level data indicated:
Data from the SEARCH for Diabetes in Youth study indicated that, during 2017–2018, the estimated annual number of newly diagnosed cases in the United States included:
Among U.S. children and adolescents aged younger than 20 years, modeled data in Figure 5 showed:
Among U.S. children and adolescents aged 10 to 19 years, modeled data in Figure 5 showed:
Figure 5. Trends in incidence of type 1 and type 2 diabetes in children and adolescents, overall and by race and ethnicity, 2002–2018
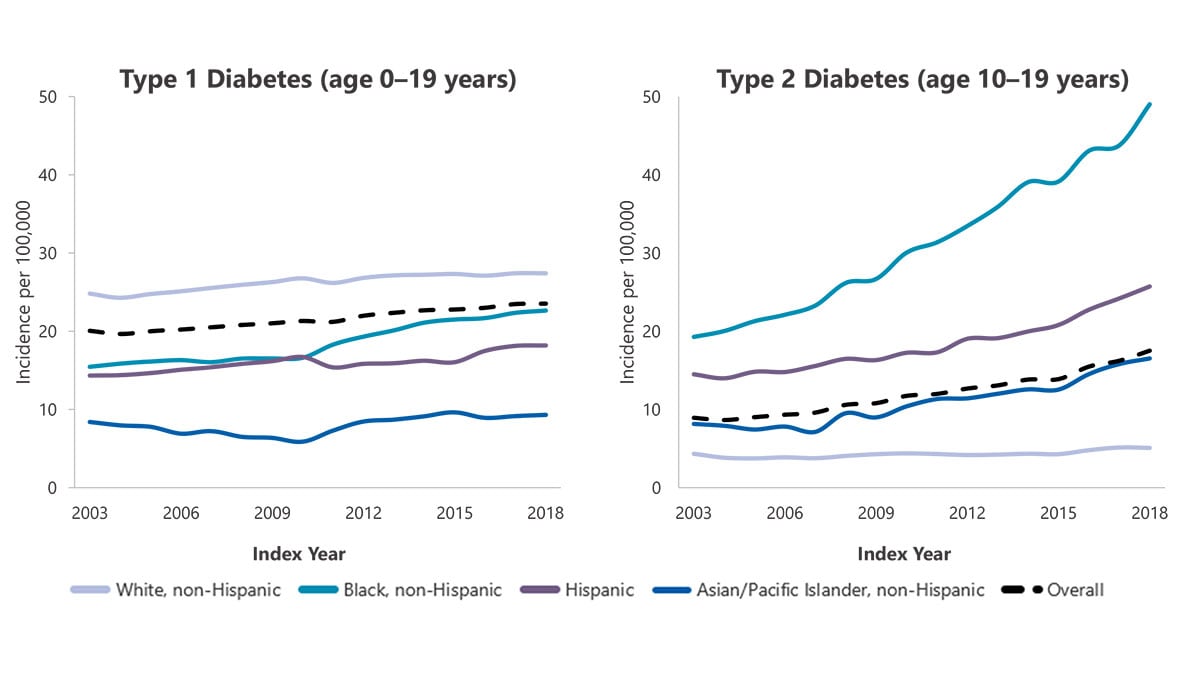
Note: Adapted from Wagenknecht LE et al 1 . Data are model-adjusted incidence estimates (see Appendix B: Detailed Methods and Data Sources).
Among U.S. adults aged 18 years or older, age-adjusted data for 2017–2020 indicated:
| Characteristic | Prediabetes, a 2021 Estimates Number in Millions (95% CI) | Prediabetes, a 2017–2020 Estimates Percentage (95% CI) | Prediabetes Awareness, b 2017–2020 Estimates Percentage (95% CI) |
|---|---|---|---|
| Total | 97.6 (91.9–103.2) | 38.0 (35.7-40.3) | 19.0 (15.0-23.7) |
| Age in years | |||
| 18–44 | 32.8 (28.2–37.4) | 27.8 (24.0-32.0) | 13.8 (9.8–18.9) |
| 45–64 | 37.5 (35.1–40.0) | 44.8 (41.7–47.9) | 20.6 (14.3–28.9) |
| ≥65 | 27.2 (24.9–29.6) | 48.8 (44.3–53.2) | 23.0 (16.9–30.4) |
| Sex | |||
| Men | 53.2 (48.9–57.6) | 41.9 (38.4–45.6) | 17.4 (13.4–22.2) |
| Women | 44.3 (40.4–48.3) | 34.3 (31.2–37.5) | 20.9 (15.5–27.5) |
| Race-Ethnicity | |||
| White, non-Hispanic | 61.8 (59.6–66.7) | 38.7 (35.5–41.9) | 17.3 (11.8–24.7) |
| Black, non-Hispanic | 12.3 (11.3–13.3) | 39.2 (35.8–42.6) | 21.9 (18.0–26.5) |
| Asian, non-Hispanic | 5.8 (5.1–6.6) | 37.3 (32.6–42.3) | 30.1 (21.0–41.1) |
| Hispanic | 15.0 (13.7–16.3) | 34.5 (31.3–37.7) | 20.9 (15.3–27.9) |
Notes: CI = confidence interval. Data are crude estimates (see Appendix B: Detailed Methods and Data Sources). Time period 2017–2020 covers January 2017 through March 2020 only.
a Prediabetes was defined as fasting plasma glucose values of 100 to 125 mg/dL or A1C values of 5.7% to 6.4%.
b Prediabetes awareness was based on self-report and estimated only among adults with prediabetes.
Data sources: 2017–March 2020 National Health and Nutrition Examination Survey; 2021 U.S. Census Bureau data.
Among U.S. adults aged 18 years or older with diagnosed diabetes, crude estimates for 2017–2020 shown in Appendix Table 8 were:
* Non-high-density lipoprotein cholesterol (non-HDL) contains all the atherogenic lipoproteins, including low-density lipoprotein cholesterol (LDL), very-low-density lipoprotein, lipoprotein(a), and others. Growing evidence supports non-HDL as a better predictor of cardiovascular disease risk than LDL 2 .
Among U.S. adults aged 18 years or older with diagnosed diabetes, crude data for 2017–2020 shown in Appendix Table 10 indicated: